Optimization is an important topic for each project, but especially for the games. We as developers want to provide our users high quality products which work smoothly on their devices. There is nothing more disappointing than broken user expierience just because game has some hiccups, low framerate and long loadings. Work of many people involved in the project will be wasted if we don’t pay attention to this aspect. Nobody want to be responsible for such failure, are you 🙂 ?
This is the place where our job starts, it’s on our hands to convice managers that additional time spent on optimization will payoff later.
Measurement
Lets say that we decided to spend some time on optimization, but how to start? Is subjective feeling while playing is enough? Can we evaluate easily that after our changes game is working smoother? Would be great to have some data to compare.
Imagine that we are working on mobile game. On the market we have hundreds of available devices. We never have chance to test the game on each of our supported devices. But we can start with choosing some representatives. As we have two main platforms: iOS and Android, would be good to have at least one low-end and high-end device per platform available.
If you are indie developer and don’t have multiple devices, there is always option to ask friends or family for a quick test 💡 . Without data we can focus on wrong things and receive poor results at the end.
In the next step we will need simple tool which allow us to measure framerate in our game. Usually it isn’t more than one or two days of work. Tool should allow to calculate a few metrics like min/max/avg FPS in the section of the game which we want to optimize e.g. gameplay, specific game mode or menu UI. Lets call it Performance Tracker 😉
It’s much better than only FPS counter, because we receive comparable results. Having such tool we can test the game on selected target devices. I recommend to store data in spreadsheet like this proposed below.
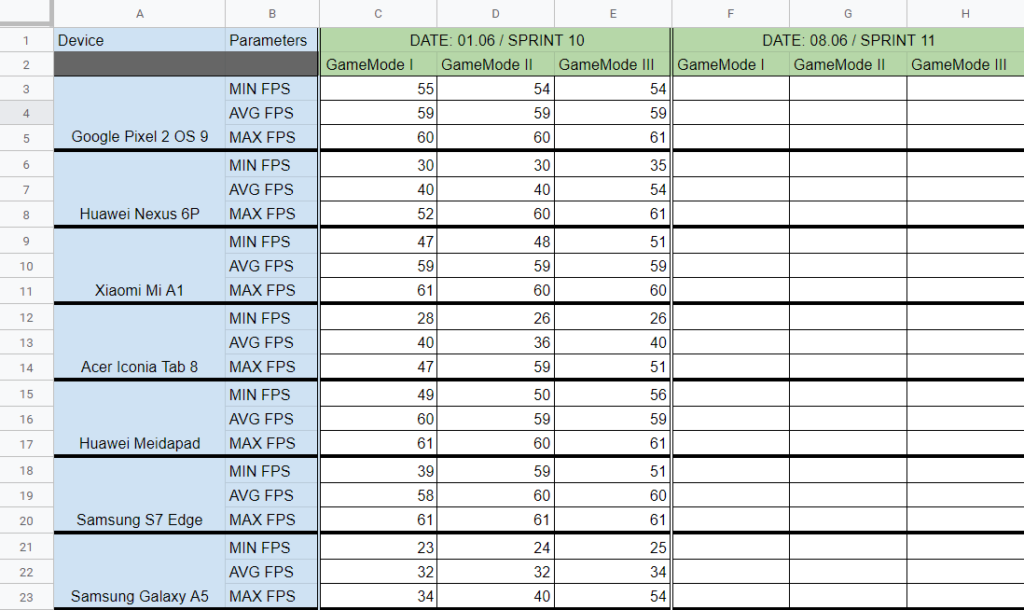
Spreadsheet will serve as as an archive, so later if we add more and more features to the game, we can check how they impacted performance of our game. We have also initial point to which we can compare results after each implemented optimization. Only thing what we need to do is to create new tab each time we measure performance.
Where is bottleneck?
We have measured performance on a few devices using our Performance Tracker. Now it’s time to analyze data. On mobile devices you can quickly notice that there are two important thresholds:
- 60 FPS – maximum for the most mobile devices (display refresh ratio), mid/high-end devices should have 60 fps in average,
- 30 FPS – acceptable for low-end devices, game renders new frame once per two display refreshes.
Lets take a device where performance is below our expectations. There are usually three areas which may cause problems:
- CPU – responsible for game logic, physics calculations and rendering,
- GPU – responsible mostly for rendering,
- Memory Access – resources loading, GC allocation and collection.
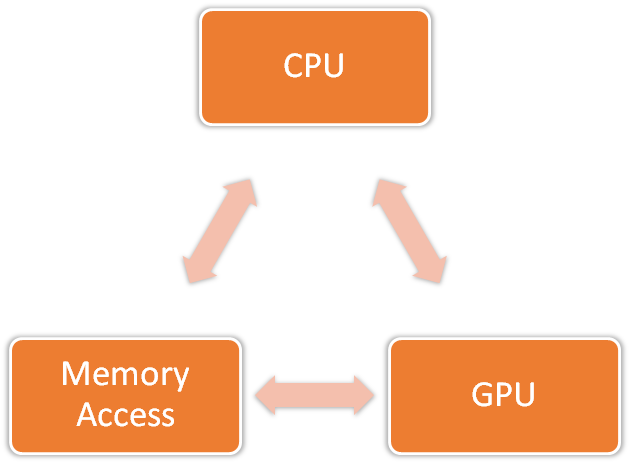
Depends on the device, problem may occur in different place. This is a reason to test on multiple devices, in the best case from different manufacturers.
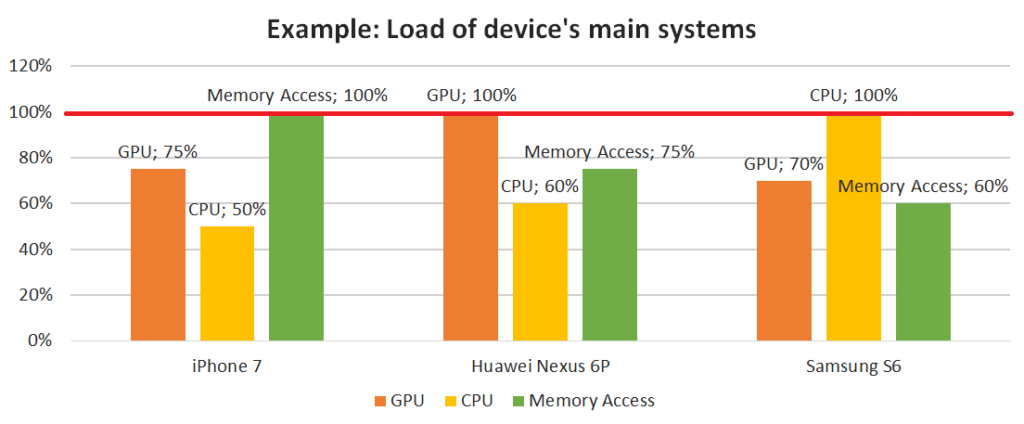
In a common scenario situation will look like on Image 3. We have three different devices and each one have bottleneck in different place. Usually optimizations in one area are causing bigger load in different area, unless there was highly not optimized implementation. For example:
- dynamic/custom batching on CPU (merging objects before rendering) will help when GPU is overloaded,
- dynamic/custom culling (disabling objects not visible by camera) will add some logic to process for CPU, but will reduce unecessary draw calls or overdraw effect and decrease GPU load,
- more expensive materials may decrease number of needed textures and help with memory issues, but will increase processing time on GPU,
- by implementing pool of objects we can decrease time spent on memory access, but CPU will need to spend time on managing the pool.
There are many examples of this type and the key during optimization is to balance them out in such way that load on each area is more or less equal on each device.
Profiling and Analysis
To dig deeper into the game and find places which have to be optimized we will need to use additional tools. Unity have multiple built-in solutions which are really helpful with finding weak spots in our game.
Statistics Window
Starting from the simplest one. In Unity Editor we can just open Statistics Window where are basic informations about rendering. By analyzing numbers from Statistics Window we can quickly determine if rendering is an issue. It’s the most common case (especially for mobile devices), because rendering can take even up to 90% of frame time.
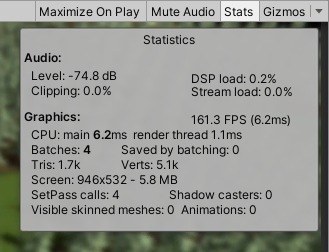
From this window we can learn the following things:
- how many draw calls (batches) are needed to display current view,
- the most important number, we should keep it as low as possible (on mobile devices I try to keep it below 50),
- number of draw calls depends on multiple factors: number of used materials, complexity of materials (can require multiple draw calls), number of static / dynamic objects, lighting settings, UI batching (atlases) etc.
- how much geometry we are displaying (tris and verts),
- rule is simple: more geometry we have, then more expensive to render it is (on mobile devices I try to keep it below 50-100K verts),
- if number is high, our 3d models can be too detailed and should be optimized,
- second common issue is an overdraw, it happens when we render the same pixel multiple times. In this case we should try to disable objects which are hidden behind other, but still rendered by camera (either by Occlusion Culling or some custom script).
- how big (in pixels) is currently Game Window,
- bigger window is more demanding in terms of rendering, because more pixels have to be processed. By changing size you can check impact of the screen resolution on performance.
- what is the current framerate,
- Depends on the PC capabilities it may be worse than on device, because editor has its own overhead.
Frame Debugger
Another useful tool avaiable in Unity Editor is called Frame Debugger. If we are not sure from where our draw calls come, this tool allow us to check them one by one. When it’s enabled, it makes a snapshot of one frame and lists all draw calls needed to render this frame. Then scrolling through the list we are able to select any draw call and check in preview or Game Window what exactly was rendered.

There are a few reasons why another draw call is needed (already aforementioned partially). Frame Debugger usually displays the reason above the preview. We should look for static elements which are rendered separately despite using the same material, textures which can be batched into one atlas, objects which could be static, elements which have different lighting settings or shouldn’t be displayed at all etc.
Profiler
At the end Profiler which is the most advanced and powerful tool for performance measurement built-in in Unity Editor. Without Profiler it would be really difficult to collect and process data about CPU and memory usage.
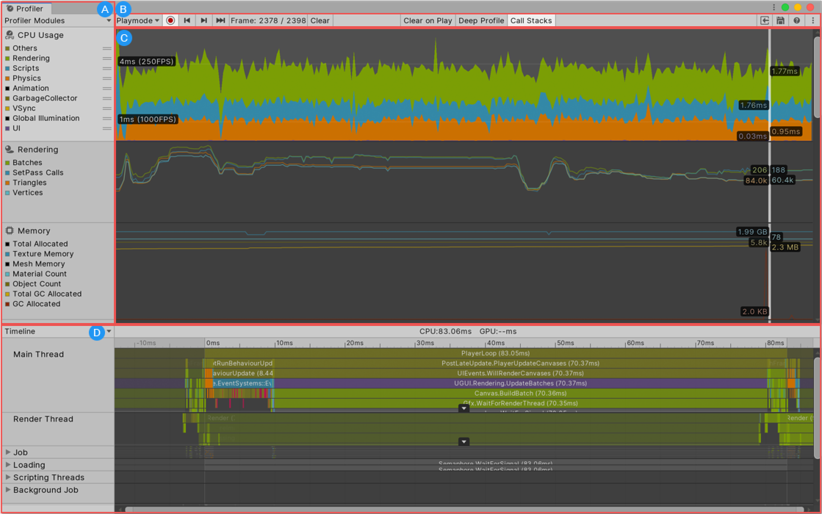
Profiler contains multiple sections related with different areas of application. The analysis should start from CPU Usage section where you can find list of methods called in specific frame with their execution time (Time ms column) and memory allocation (GC alloc column). Deep Profile option allows to dig deeper in execution stack trace, however it might not be available if your code base is really complicated (for example is based on complex frameworks). In this case you can use BeginSample/EndSample methods to cover code which you would like to profile (like in example below).
public class ExampleClass : MonoBehaviour
{
    void Example()
    {
        Profiler.BeginSample("MyPieceOfCode");
        // Code to measure...
        Profiler.EndSample();
    }
}
Remember that you shouldn’t measure performance during profiling, because your application will run much slower than in normal conditions (especially when Deep Profile is enabled). Additionally, it’s better to profile on the target device than in editor. To do this you have to build development build. While profiling in Unity Edtior you can encounter some methods in stack trace which are related with editor-specific features and are not present in runtime on the device.
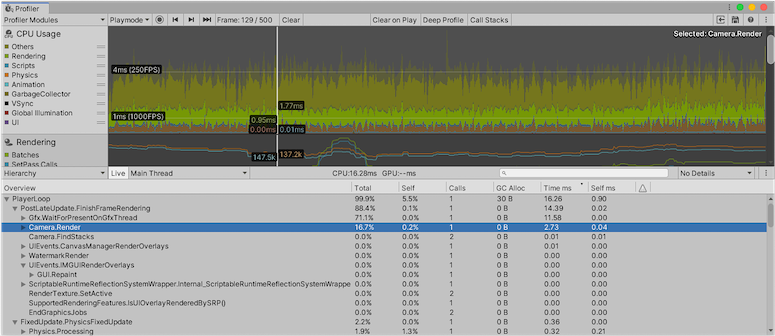
Going back to data available in CPU Usage section. GC Alloc column can tell us about problems with memory access. Garbage Collector in managed languagues (like C#) is responsible for tracking and releasing not used memory. It’s bad sign when your game allocates something each frame. Even a few KB per frame can decrease performance significantly. My record is over 20 FPS increase only after GC allocation optimizations (on Samsung S5 from 2014, framerate jumped from 25~ to stable 45-50 FPS).
Garbage Collector is a silent killer of the game performance. While you allocating a lot of data, the same operations become more and more expensive over time. System needs to find free space for new objects. Garbage Collector updates constantly counters of references. If needed goes through the memory heap and releases not needed elements what generates spikes / hiccups in your game. Fragmentation of memory is progressing what in edge cases can end up with StackOverflowException and crash 🙁 .
Second important parameter is Time ms. It shows how much time is consumed by specific method. Usually most of the time is spent on the rendering where helpful are aforementioned Statistics Window and Frame Debugger. To track problems with CPU Usage we should focus on methods related with game logic, physics, processing input etc. While you find method which takes more time than expected, you can also check Calls column. Often methods can be called dozen of times in one frame. In this case you may optimize it by storing intermediate or end results of expensive calculations. Try to avoid redundant calls, for example raycasting, pathfinding, instantiating or any other complex method.
Sometimes processing time of single frame may vary a lot. In common situation average frame is processed in reasonable time, but once per a few frames you have spikes / hicupps. If we checked that Garbage Collector is not the reason, there might be some expensive logic called regularly like loading a bunch of new objects / map tiles. In this case solution can be asynchronous execution, logic might be portioned and executed in Coroutine or separate thread.
Summary
Performance optimization is quite specific and highly project dependent. There is no one rule which will solve all issues, but when you have standardized and systematic approach, I am sure that you will achieve your goal 😉 . Performance measurement should be started from early stages of the project. It will allow you to track changes and react faster. If you wait till the end of the project with optimization, task will be much harder. There are a few reasons:
- complex logic is more difficult to profile and debug,
- bottlenecks might be hidden deep in the game logic,
- sometimes game architecture is a problem and optimization requires game-breaking changes,
- ART assets may require huge rework.
I usually try measure performance once a month, however it might vary a lot. Schedule should be adjusted to the size of the project and amount of people working on.
Thank you for reading, I hope post was interesting to read 🙂 . More details and examples about optimizations related with each of mentioned areas: CPU, GPU and memory access will be added in upcomming articles.

Neat Web site, Continue the fantastic work. Regards!
I treasure the info on your websites. Much thanks.